Real-Time Data Visualization Services

With Scraping Intelliegence’s real-time data visualization services you no longer have to toil through loads of data to find the insights. We make data discovery simpler with visual representations that do the storytelling. Enjoy the data narrative and connect the dots without draining your brain with powerful data visualization dashboards that deliver all the insights you need for logical and data-driven decision-making.

real-time-data-visualization-services

Decode Hidden Insights in Data With Real-time Data Visualization

"Data visualization enriches data sets by adding visual elements for their interpretations. Use Scraping Intelligence’s real-time data visualization services for translating data into powerful insights and insights into impactful decisions."

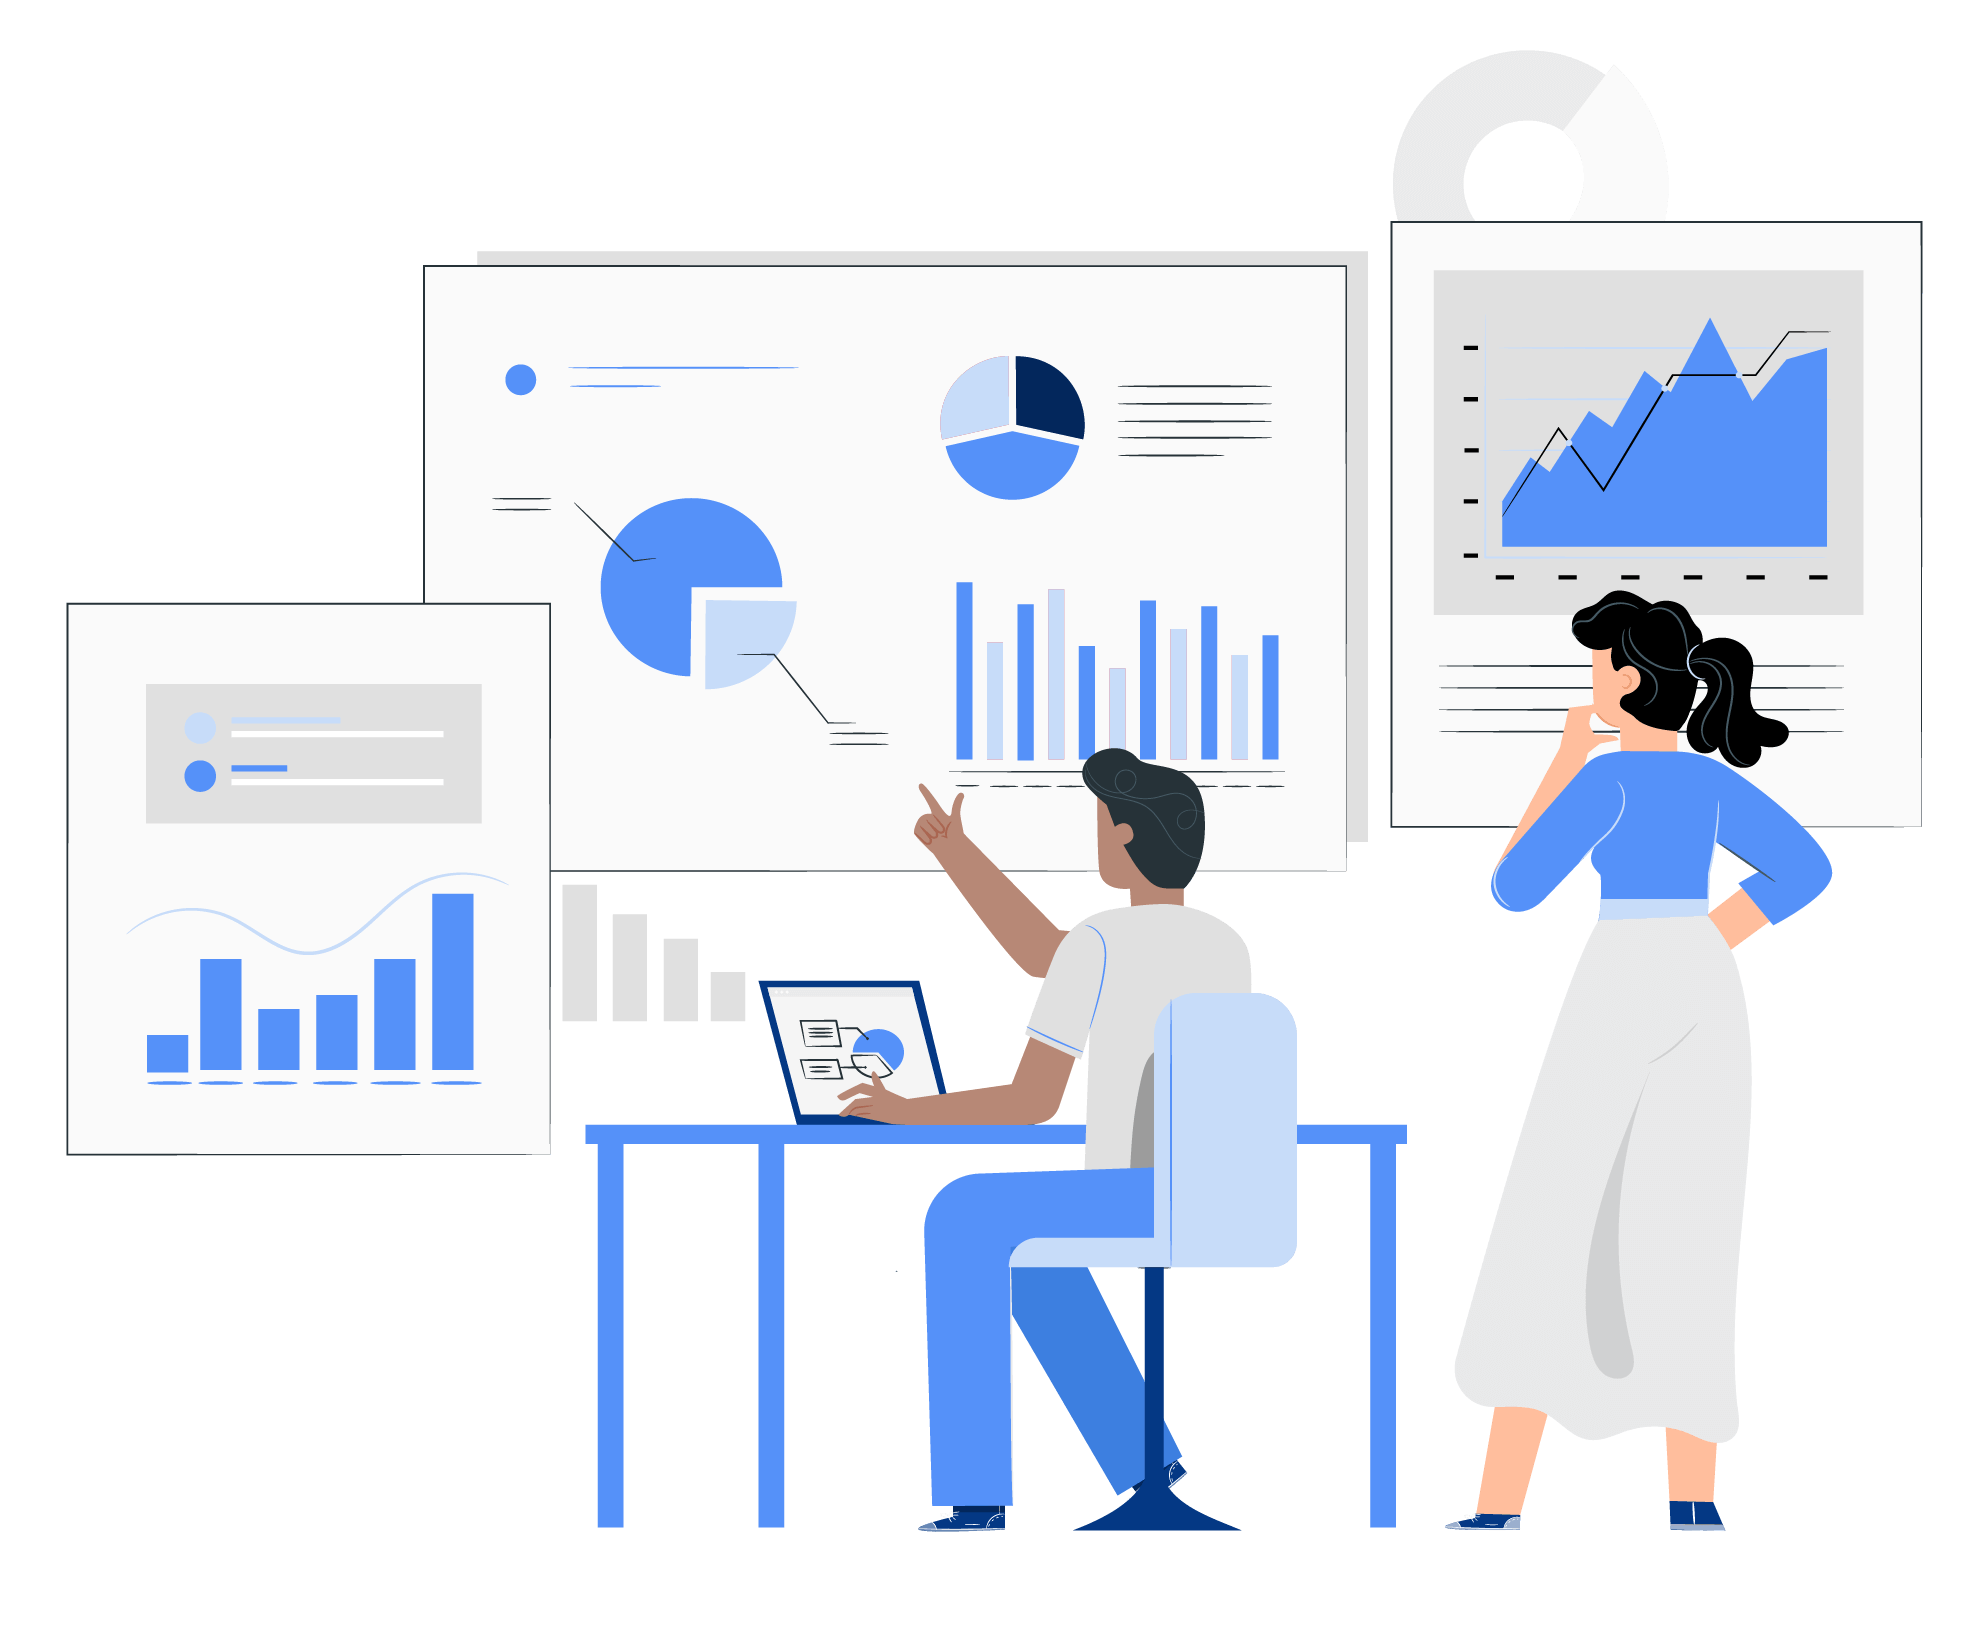
Even the most sophisticated data science models, data analytics methods, and data extraction techniques will only be rendered effective if the data is visualized with tools and dashboards capable of presenting the data like a story. Data is useless If you can’t see the patterns, trends, and insights hidden within the data

CEOs and decision-makers in organizations are often overwhelmed by data overload. Traditional BI and reporting processes hamper their capabilities to make rightly timed decisions due to data complexity issues. This is where data visualization services by Scraping Intelligence help them transition from data shock to meaningful data insights for real-time decision-making.

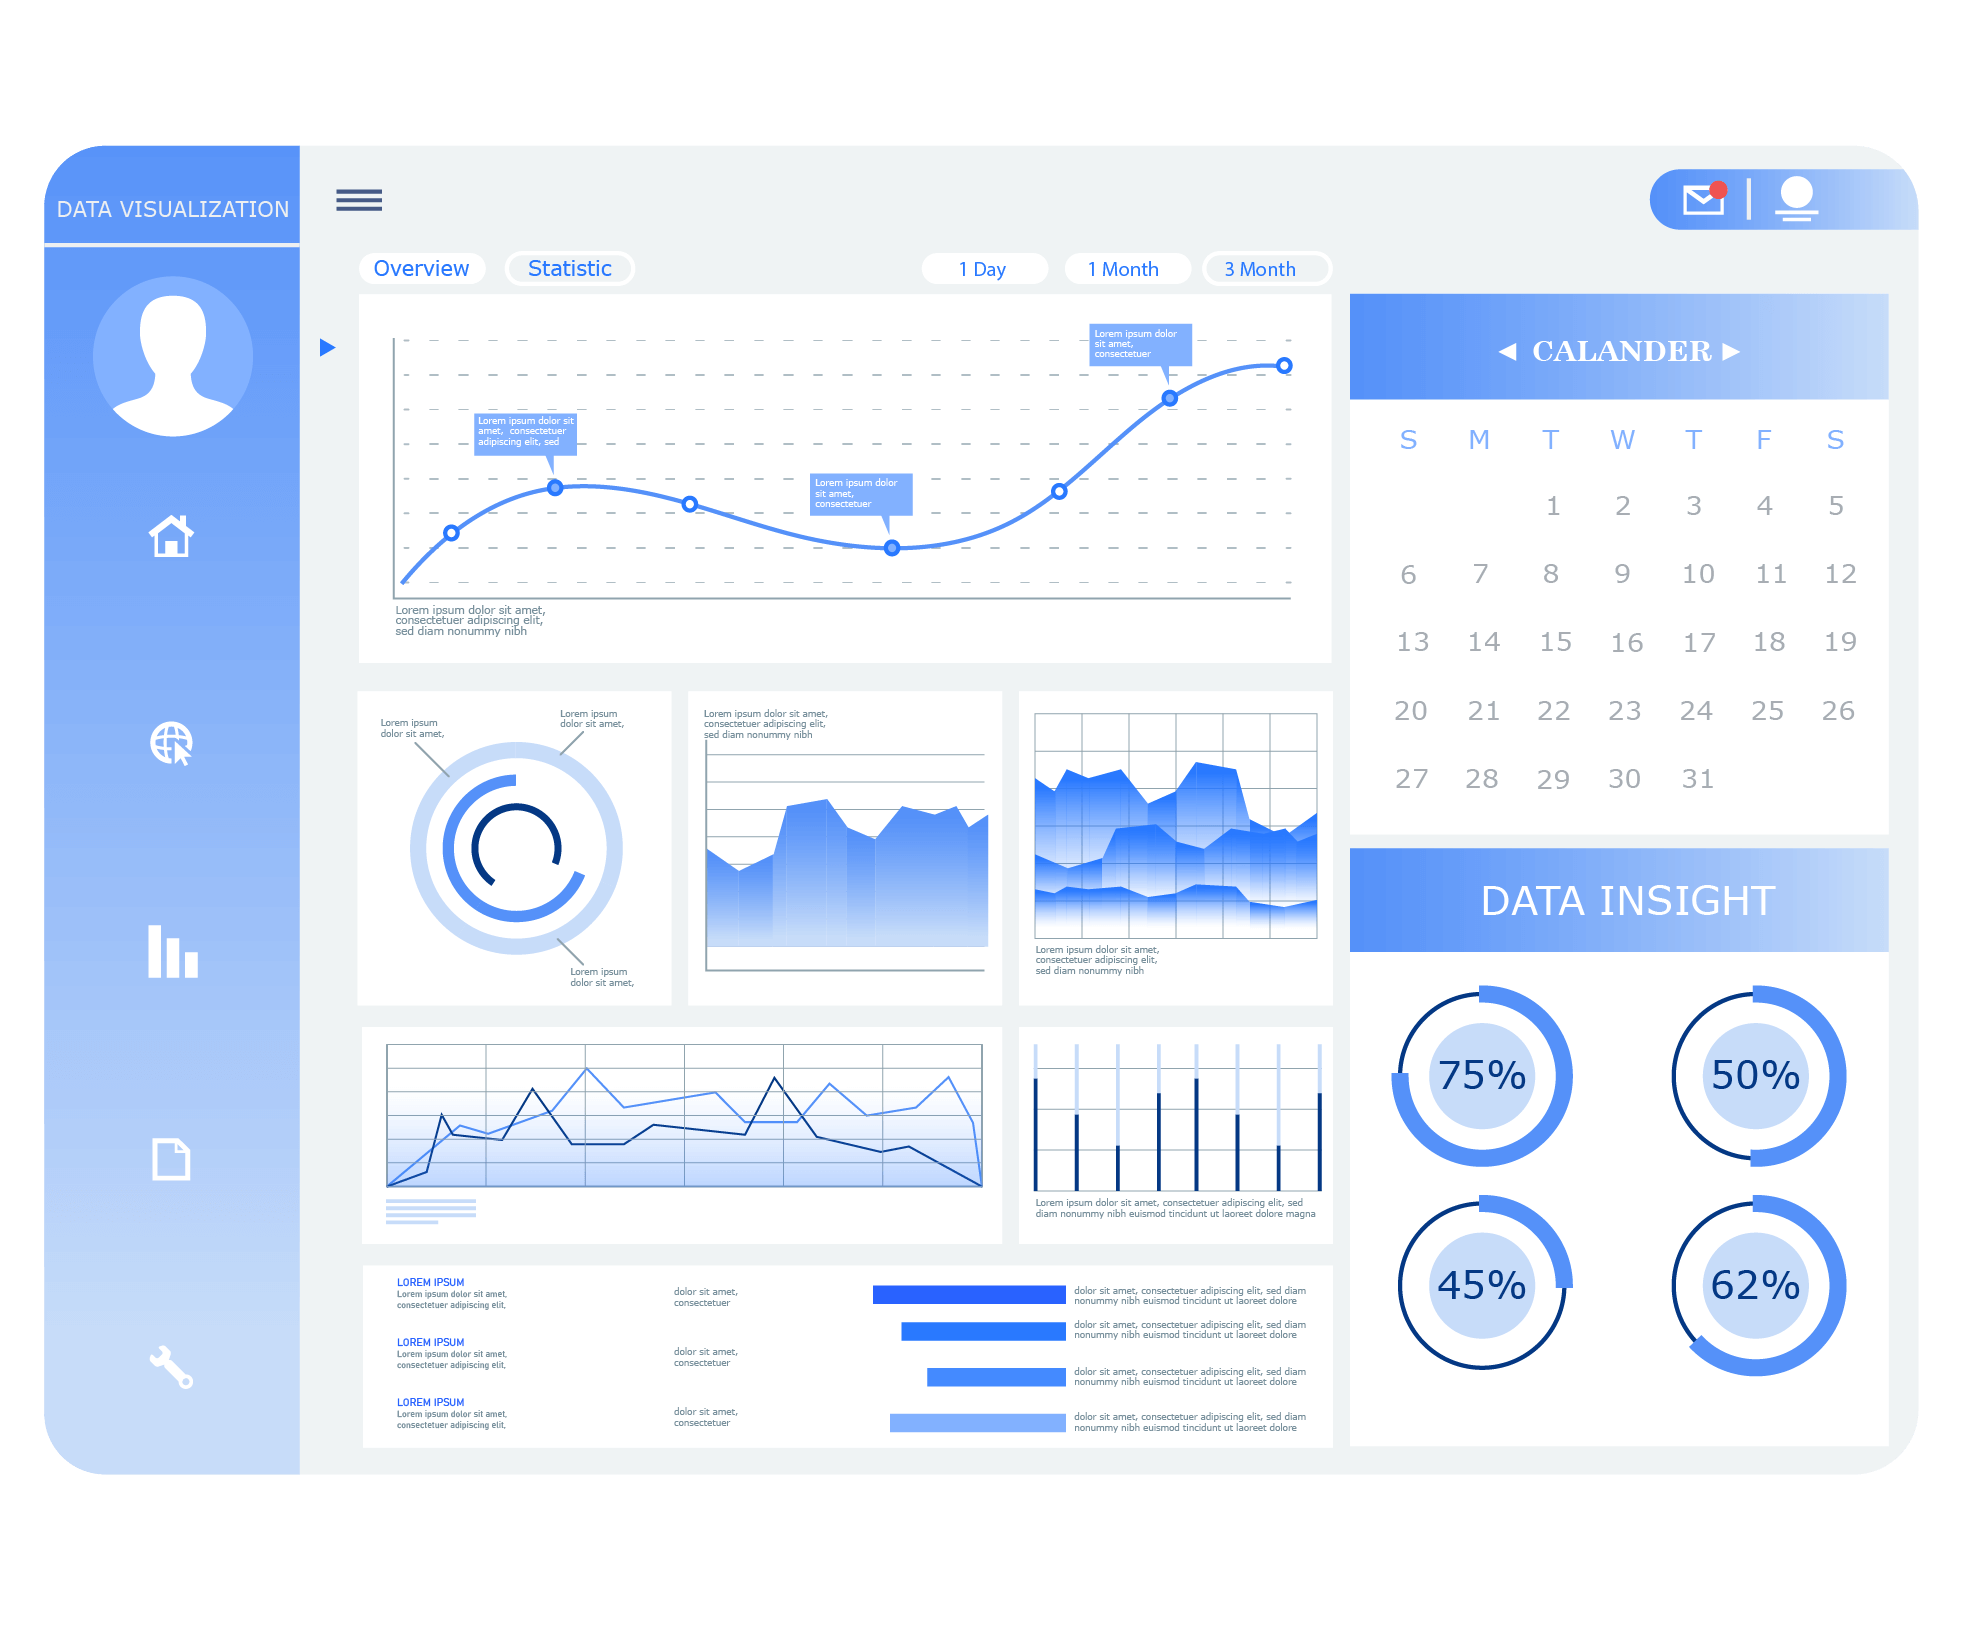
Our optimized custom dashboards are designed for easy comprehension of collected data, presenting even the most complex datasets in an engaging and simple-to-understand manner.

data-visualization-that-can-see-the-big-picture

Data Visualization that Can See the Big Picture

Data shock is real. In today’s omnichannel business world, organizations are creating a humongous amount of data from multiple touchpoints. Also, they need to monitor similar data sets of their competitors and other industry leaders. Consumer-generated data is another addition to the existing data sea. Businesses also need insights from consumer data points to improve their products/services further. However, with the scale at which data is produced every day, business managers cannot skim through the data texts to find meaningful insights or the key ‘info’. Data visualization is the prudent solution that lets them see the big picture on custom dashboards designed for extracting and presenting the data that matters and insights that can be capitalized.

collect-omnichannel-data
Collect Omnichannel data
Automation Icon
High-quality Analytics
API Integration Icon
Identify relevant data points
IP Support Icon
Error-free visualizations

Connect the Dots From Data to Decisions

Data from all business segments and departments must be considered and analyzed for making decisions. All variables and metrics obtained from different business data sources should be processed together to find the cumulative insights. However, even with all data in one place, it will drain the brains of decision-makers to find the correlations.

This is where data visualization helps business leaders in connecting the dots. Scraping Intelligence’s Data visualization services will collect, map, and brainstorm the data and finally present the same in visuals that will help you find the connections between variables, insights, and key vitals hidden in data within no time.

Data visualization tools eliminate the ‘data rich but insight poor’ fallacy from the organization and also remove the data silos that hamper business managers to make data-driven decisions.

Insightful Data Discovery on Stunning Dashboards

From logically grouping data sets and key metrics to conveying key information on stunningly beautiful and interactive dashboards, we make data exploration and visualization a hassle-free experience for you. Get a narrative of what your data tells on interactive dashboards that show data in the forms of Gantt charts, Box and Whisker Plot, heat maps, geospatial representations, category tables, tree maps, pie charts, pictograms, histograms, bubble clouds, Ring charts, Venn diagrams, Co-relation matrix, Network Matrix, timelines, infographics, and many more.

Special Features of Our Data Visualization Services

real-time-visualization
Real-time Data Visualization

Achieve faster data pipelines with real-time data extraction, processing, and analysis. Our real-time data visualization services will present the data on dashboards that refresh in milliseconds and serve the latest data insights.

visually-appealing
Visually Appealing Data

With Scraping Intelligence, get the extracted data converted into well-structured and visually appealing reports with elements like graphs, pictograms, charts, trendlines, etc. for easy interpretation.

data-accuracy
Data Accuracy & Quality

Scraping Intelligence uses advanced data scraping tools and adheres to the highest standards of data collection techniques to keep the data accurate and error-free. This increases the quality of data insights that you get on our visual dashboards.

How It Works: Procеss of Data Visualization

Data Visualization Services is a difficult process, and below it is shown how the process works.

  1. Define Goals

    Make a list of targets you want to achieve. Keep it precise and accurate.

  2. Gather Data

    Start collecting the target information from the right platform.

  3. Data Format

    Filter and organize the data to make it easier for analysis.

  4. Start Analyzing

    Figure out the patterns and trends from the data as required.

  5. Build Visualizations

    Take the steps to put data into action with smart solutions.

Start Investing In Data Visualization Services To Grab Potential Leads!

Usе Casеs of Data Visualization Services

Complexities overshadow clarity. Dense data sets are useless if you are not able to grasp the context. From cutting the non-essentials in data points to providing clear direction in data-based decision-making, the use cases of data visualization services vary from business intelligence to industry trend analysis.

Business Patterns

Business correlations and patterns that are otherwise difficult to identify from leaps of data structures can be easily detected when transformed into visual formats.

Industry Trends

Knowing emerging industry trends right at the outset can help you capitalize early on the budding trends. Data visualization is key to spotting & confirming the evolving trends.

Business Intelligence

Data visualization eliminates the guesswork from complex data sets and provides the business intelligence that CEOs & managers need for strategic decisions.

Performance Monitoring

KPIs, metrics, ratios, comparison tables, and trendlines served by data visualization dashboards help you easily monitor your business performance.

Competitor Monitoring

Data visualization services are what you need for a distinct advantage over your rivals. Monitor competitor data & visualize for insights that help you get ahead of your peers.

Data Story

Visual representation makes the data story compelling and far more interesting. Also, it is easier for business leaders to grasp the main essence if data is told like a story.

Decision-making

Fast-loading dashboards that fetch & process data in real-time and display valuable insights take your decision-making process to the next level.

Data visibility

Composite visualizations provide a complete overview and visibility into the data sets. Get unified data visuals from multiple departments & business segments.

Why Choose Us

why-choose-us

Why Choose Us

Are you in search of a authentic and unparalleled data scraping solutions?

Our cutting-edge scraping techniques ensures timely delivery, precise, timely data extraction customized to your requirements. With a record of success, we deliver reliable results that deliver valuable insights to your business assisting in strategic decision-making.

We tailor solutions to your specific data needs.

Experts in your industry, ensuring accurate and relevant results.

We provide top-notch services without breaking the bank.

Your data, your way - we make it happen.

Compliant, Secure, and Respecting data privacy.

Expertise Icon
Expertise

Benefit from our seasoned team of web scraping professionals.

accuracy-quality
Accuracy & Quality

We guarantee accurate and reliable data to fuel your success.

no-blockages
No Blockages

We have the tools and techniques to navigate through obstacles.

on-time-delivery
On-Time Delivery

Count on us to meet your data needs promptly and efficiently.

F.A.Q

Check Out the List of FAQ's to Solve Your Queries.

Client Testimonials

Featured Positive Feedbacks and Testimonials from Satisfied Clients.

testimonial-icon

 The Scraping Intelligence team was extremely professional, detail-oriented, and dedicated to providing the highest data quality.

Andy Jordan
United States
testimonial-icon

 We are thoroughly impressed with their cost-effective data solutions. Their commitment to work makes them our forever go-to data scraping partner.

Marko Herz
United States
testimonial-icon

 Working with Scraping Intelligence since last 3 years is a remarkable experience thing because we have always received a prominent result.

Caitlin Brady
Australia
10685-B Hazelhurst Dr.#23604 Houston,TX 77043 USA

Incredible Solutions After Consultation

  •   Industry Specific Expert Opinion
  •   Assistance in Data-Driven Decision Making
  •   Insights Through Data Analysis